
Idea analytics shows the overall idea reports of a particular site. Everyone can see the idea analytics that shows the growth, improvement and the productivity of the organization.
Overall Stats Reports
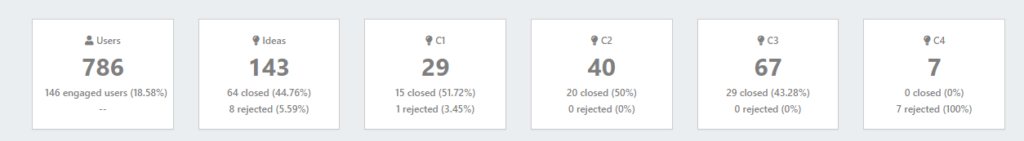
- Users : Stat shows the number of registered users and how many of those become engaged with an idea (Committee Members, Reviewers, Stakeholders and Team Members).
- Ideas : This shows the overall count of ideas posted and from that the count of closed and rejected ideas in selected time period.
- C1 : It shows the total number of C1 ideas posted and from that the number of closed and rejected ideas during the selected period.
- C2 : It shows the total number of C1 ideas posted and from that the number of closed and rejected ideas during the selected period.
- C3 :It shows the total number of C1 ideas posted and from that the number of closed and rejected ideas during the selected period.
- C4 : It shows the total number of C1 ideas posted and from that the number of closed and rejected ideas during the selected period.
Daily Trend
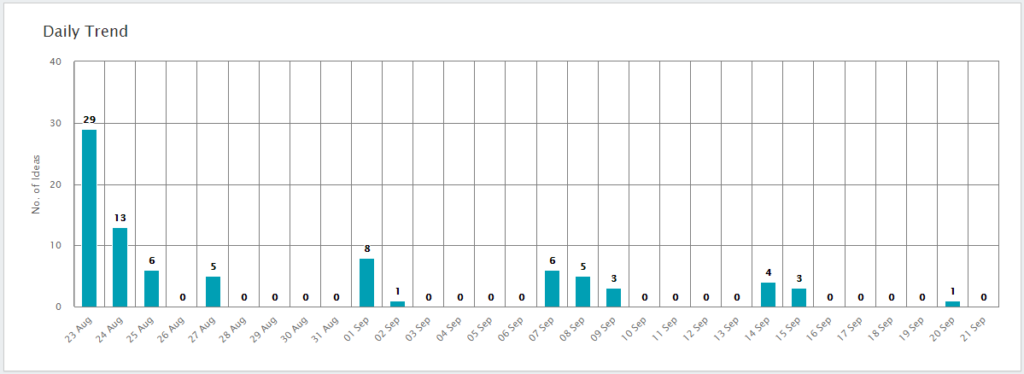
In the Daily Trend report, the number of ideas posted daily over the last 30 days is shown.
Innovation Trend
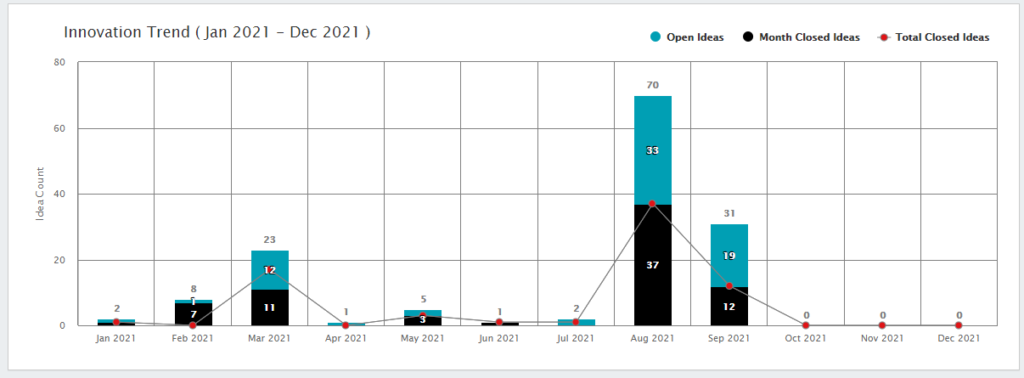
An analysis of open, closed, and total closes ideas within a particular time period.
Idea Reports by Idea category.
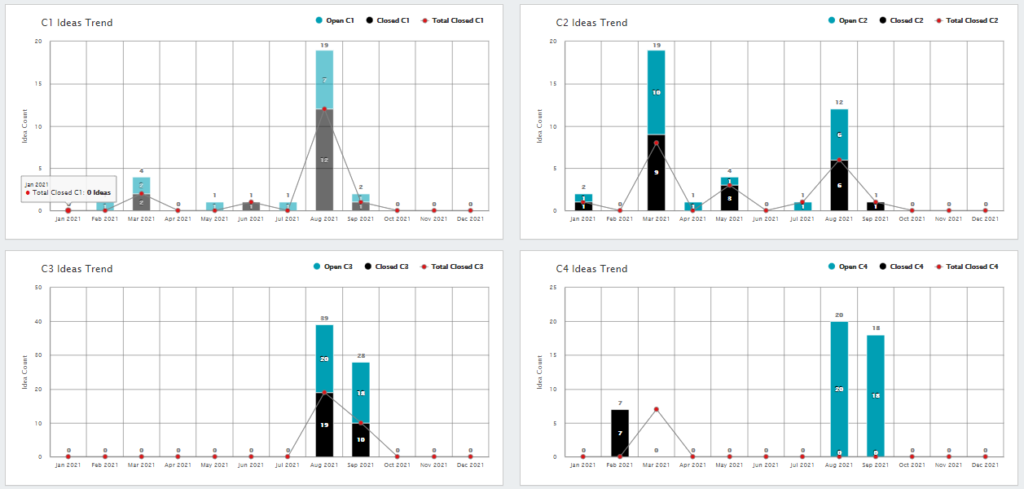
Reports of open, closed, and total closed ideas are displayed according to C1, C2, C3, and C4 categories.
Idea Overdue Report
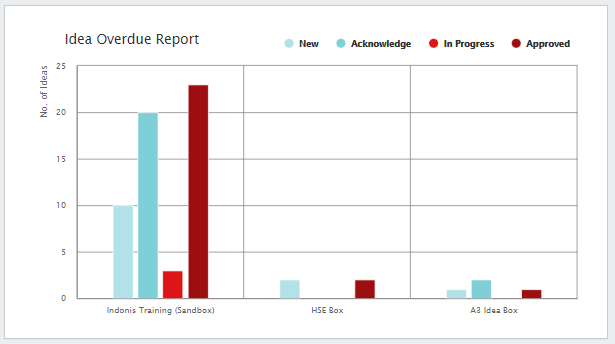
This is the idea overdue report that shows where ideas are pending at particular stages and the time limit for the idea boxes has now expired.
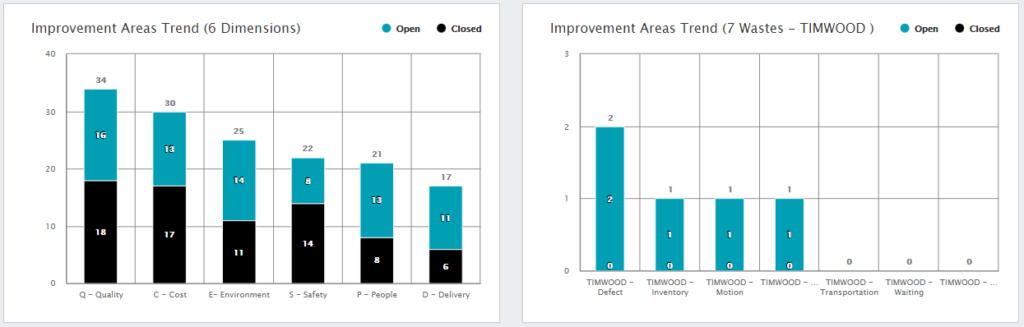
Idea Report by Impact areas and 7 waste
Idea Reports by Idea Source, Application Area, Functional Area and by Implementation Scope
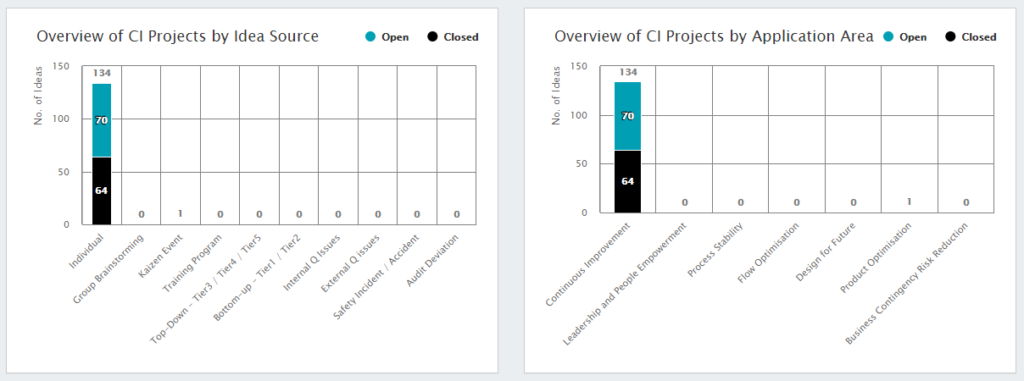
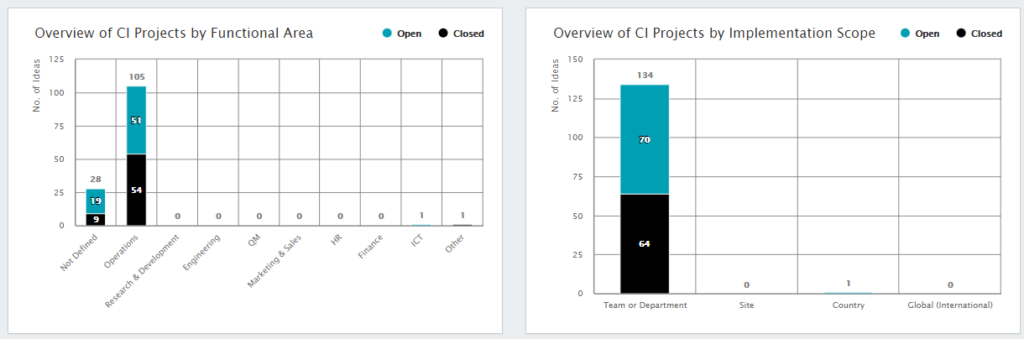
It will shows ideas count that are involved in these types of idea source, application area , functional area and implementation scope.
Idea Trend Report By User Type
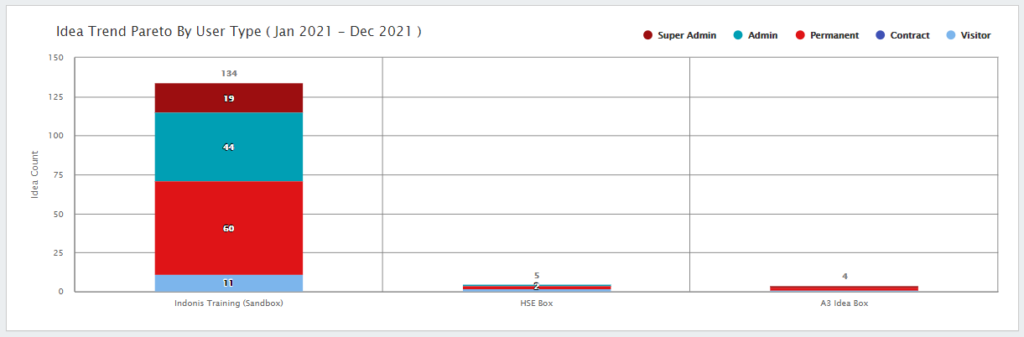
This report is generated to achieve the goal of how many users are of their particular user types are involved in adding idea in selected time period and in respective idea boxes.
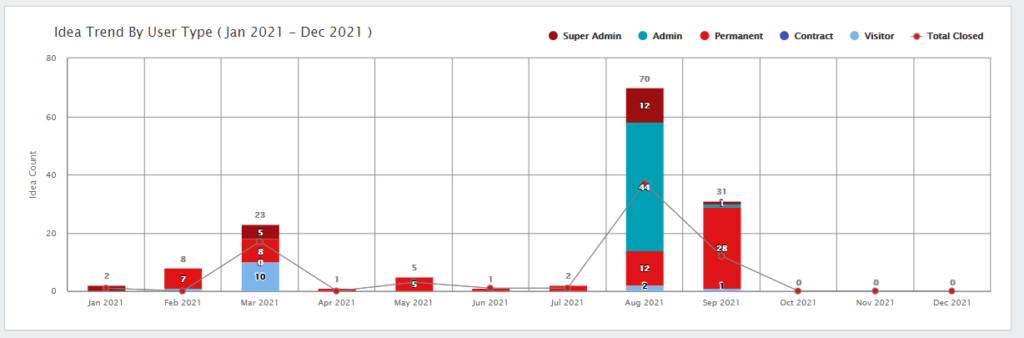
This report is generated to achieve the goal of how many users are of their particular user types are involved in adding idea in selected time period and by months.
Idea Ageing Report
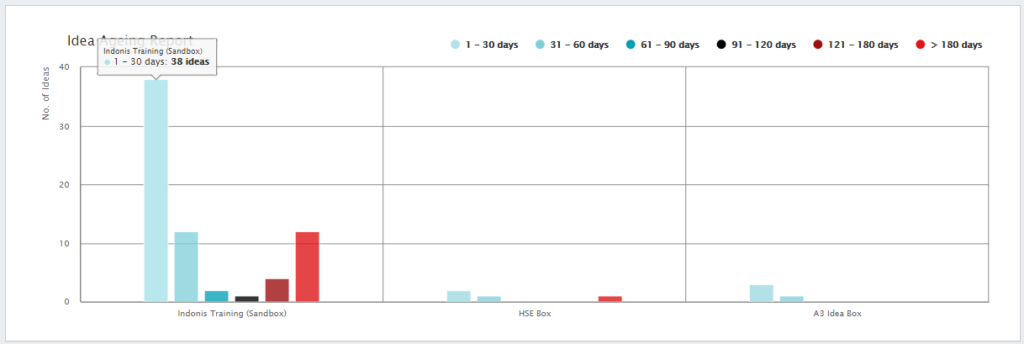
By aging the 30 days to the last 180 days, the report displays ideas by idea box.
Idea Box Owner Report
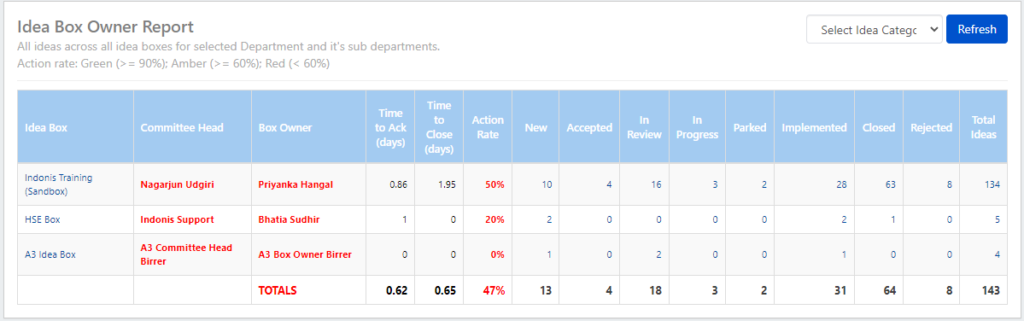
The report displays the total number of ideas for all boxes within the selected category for each stage.
Monthly Department Report
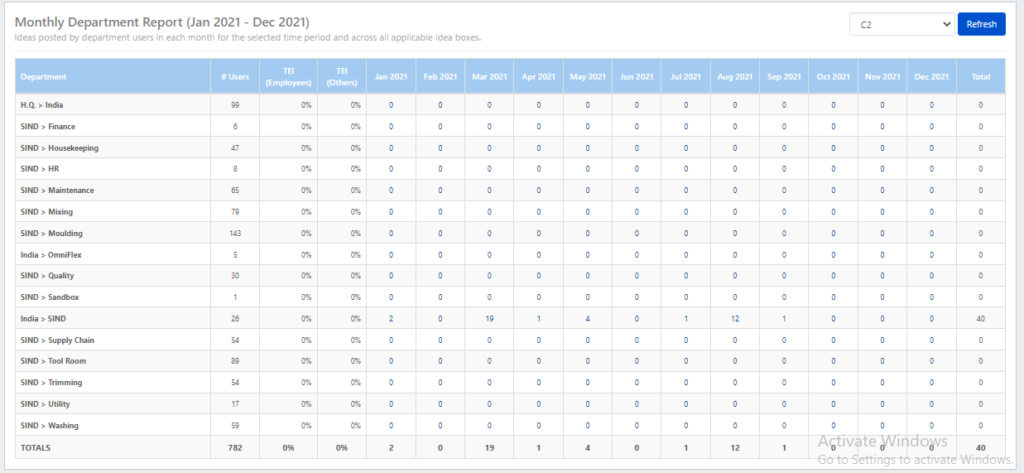
The report displays the total number of ideas for all departments within the selected category for each stage.

Leave A Comment?